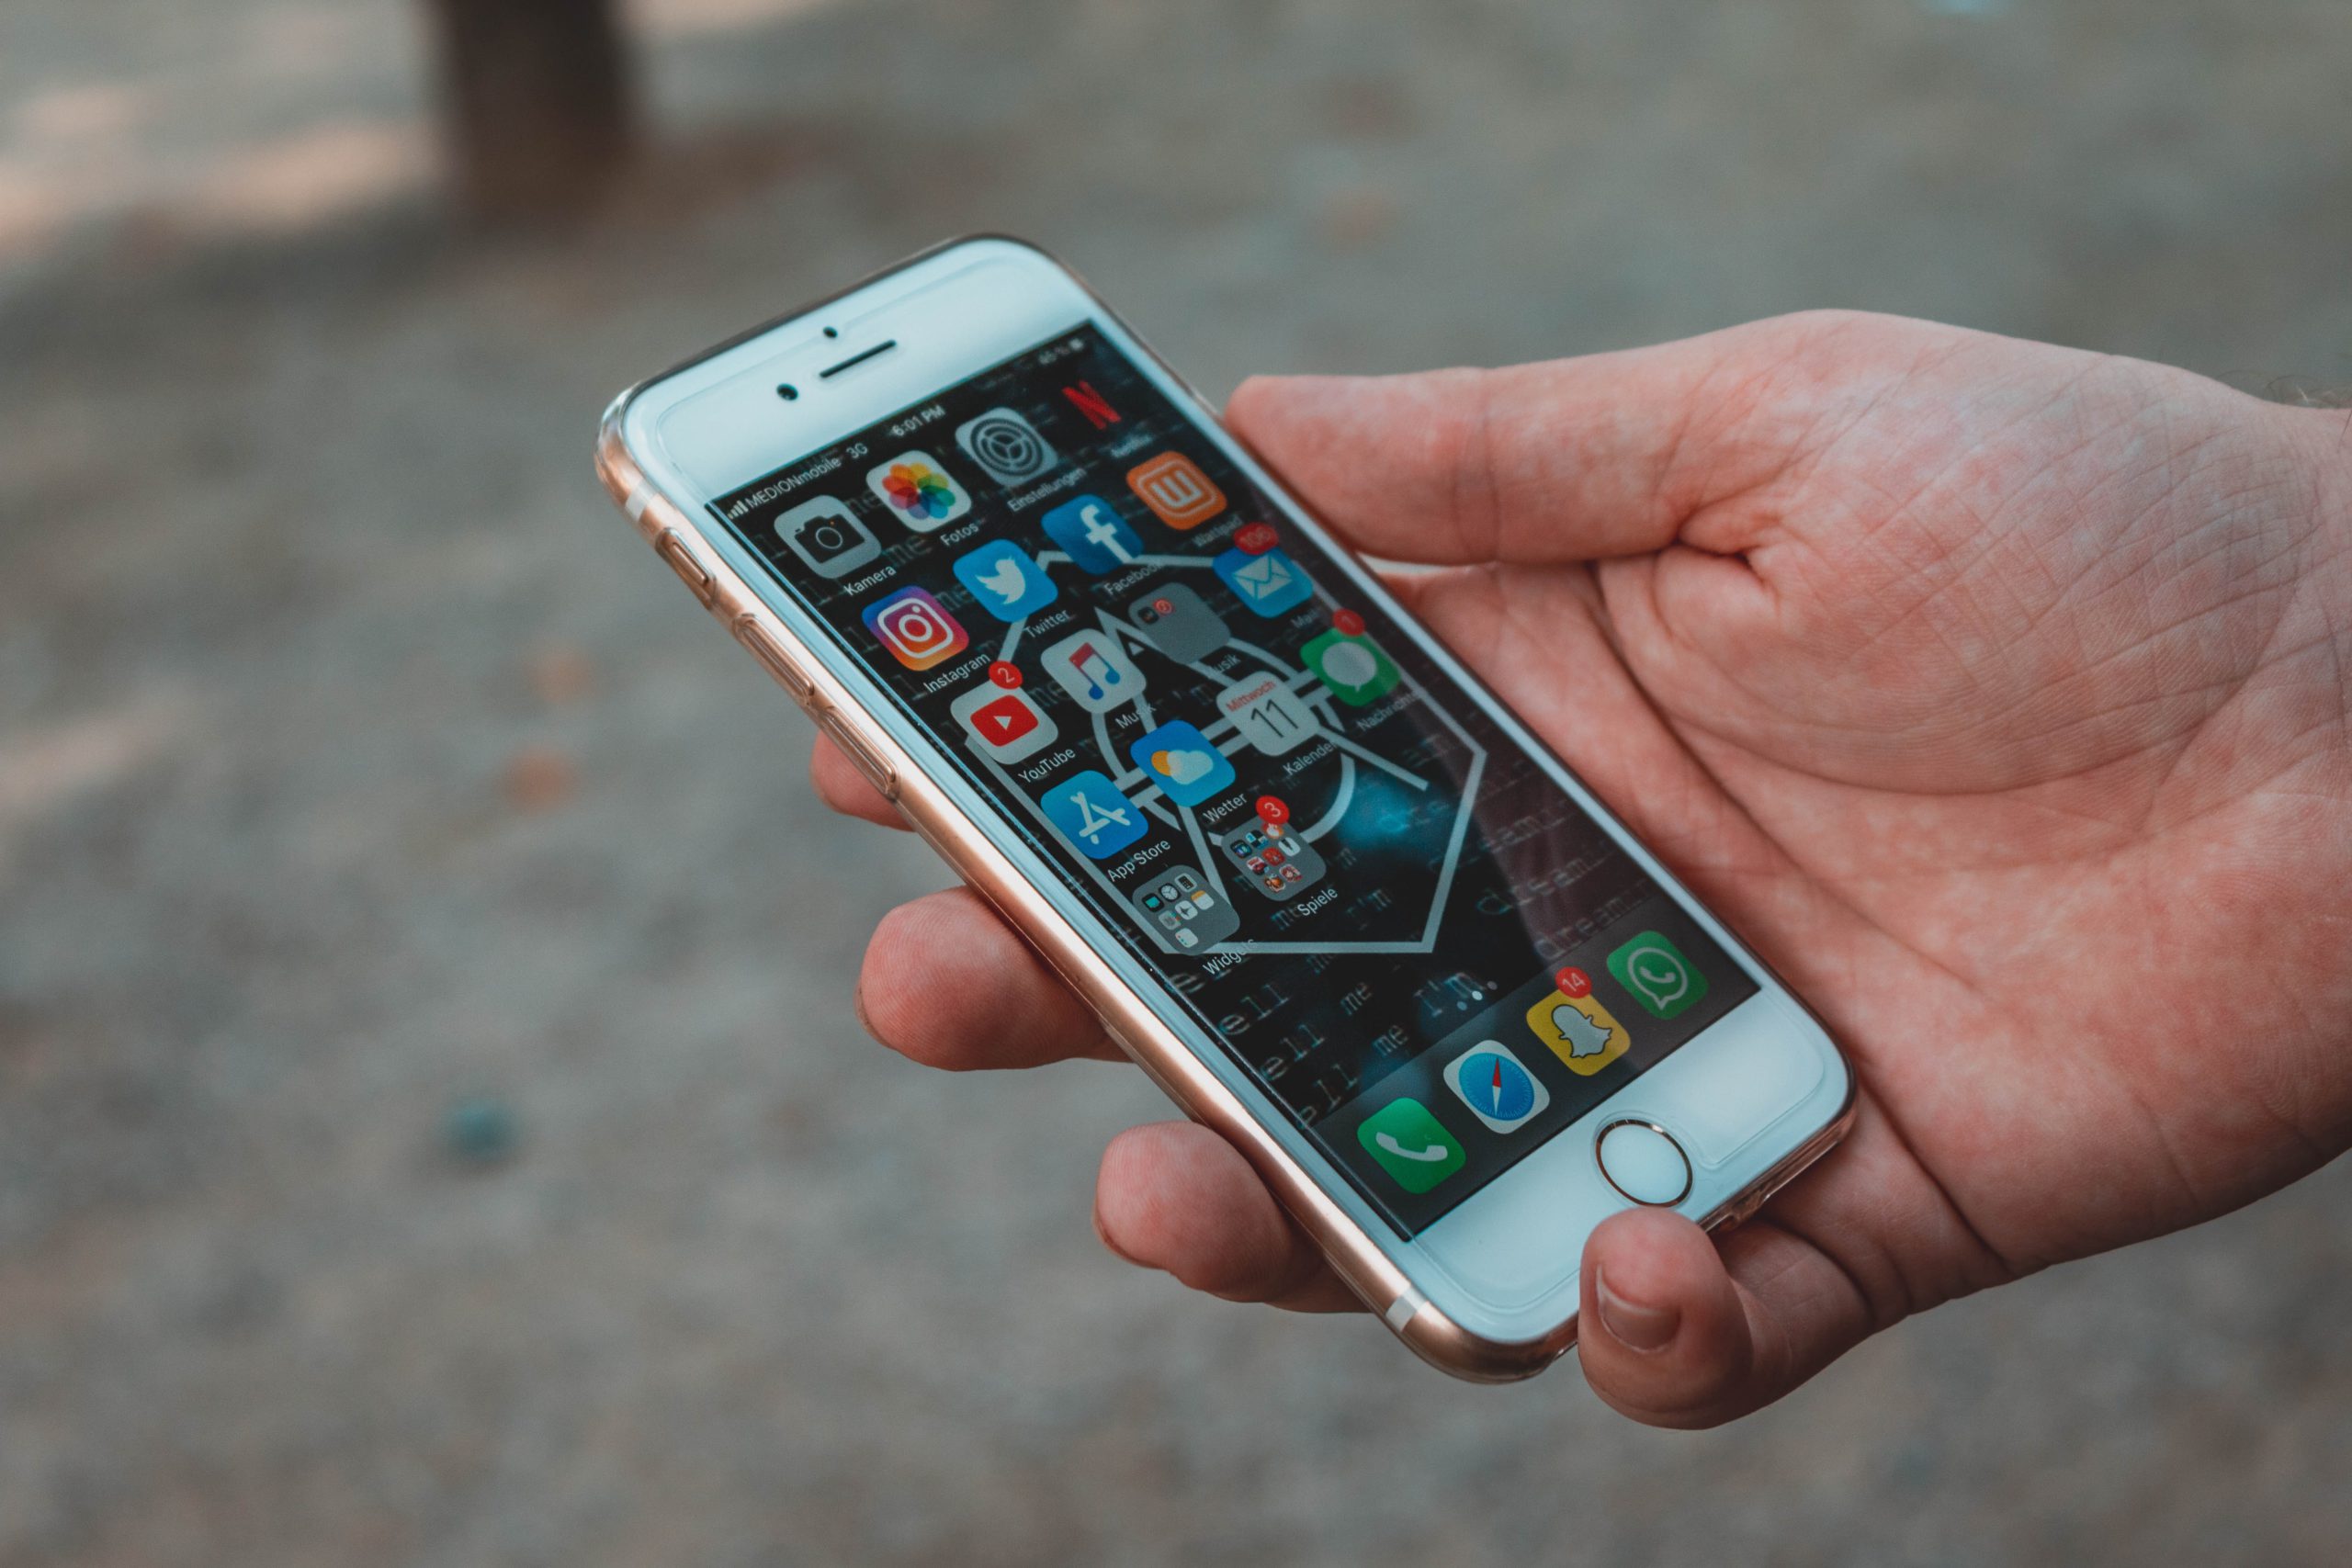
Consumers spent a total of $51.8 billion on the Apple App Store in the first nine months of 2020. Comparatively, they spent $27.6 billion on Google Play Store during the same period.
However, according to the research data analyzed and published by SafeBettingSites.com, iOS only has a 24.99% share of the mobile operating system market globally. In contrast, Android has a 74.43% share.
iOS Holds 60% Market Share in the US vs. 40% for Android
During the first half of 2020, consumer spending on the App Store during H1 2020 grew at 24.7% year-over-year (YoY). On the other hand, Google Play revenue grew at 21%, while overall growth on both stores was 23.4%.
In Q3 2020, however, App Store spending grew by 31% YoY against Google Play’s 33.8% and gained an overall growth of 32%. Interestingly, Google Play accounted for 81.5 billion downloads during the first nine months of 2020. In contrast, the App Store had a total of 26.5 billion downloads during the same period, three times lower than Play Store’s.
Moreover, the US was the leading market for iOS during the period, both in terms of downloads and consumer spending. It comes as no surprise given that the iOS market share in the country is 59.71% against Android’s 40.09% according to Stat Counter. In Q3 2020, the top categories for consumer spending were games, entertainment and photos & videos.
Based on a study by App Annie, mobile app usage increased a remarkable 40% in Q2 2020, coinciding with lockdowns and remote work trends. April hit an all-time high of 200 billion hours in total, with an average of 4.3 hours every day. In Q3, users spent at least 180 billion hours on their devices each month, a 255% increase YoY.
According to an eMarketer forecast, US mobile users will spend an extra 23 minutes on their devices in 2020.
The full story, statistics and information can be found here: https://www.safebettingsites.com/blog/2020/10/27/apple-app-store-revenue-surpasses-51-billion-ytd-double-google-plays-revenue/


