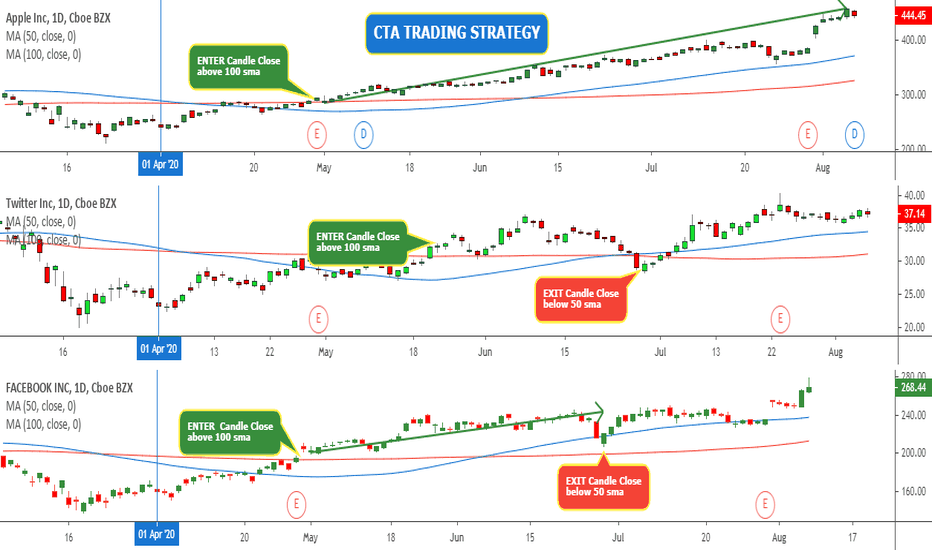
Generally, a CTA fund is a hedge fund that uses futures contracts to achieve its investment objective. However, good fund managers actively manage investments, using discretionary strategies, such as fundamental analysis, in conjunction with the systematic trading and trend following.
What is CTA Trading Strategy?
CTA stands for Commodity Trading Advisor. CTAs are generally professional investment advisors who manage investment funds designed to make daily forecasts on commodity futures in order to generate profits from commodity futures trading. CTAs are also known as Commodity Pool Operators (CPO), Futures Commission Merchants, and Commodity Trading Advisors (CTA).
What is “Trend Following”?
Trend following is a trading system that is designed to take advantage of prevailing trends in the financial markets such as, for example, long-term trends in stocks, bonds, or precious metals. Trend followers attempt to exploit the inherent momentum of the market in any direction by identifying the financial instruments and market environment that favor trend-following techniques. A trend follower buys an instrument that is currently in a strong uptrend, and then waits for the uptrend to stop before selling and re-investing in a new financial instrument that is currently trending up. Gold is one example where it seems like a good choice for a trend follower. Trend followers normally buy gold futures in a bull market and sell in a bear market.
Trend Following is a “Binary Solution”
According to a daily market review by Bryce Gilmore, a trend following trader, “Trends never last; they should be exploited by trend followers, and when they die, it is time to sell.” This is the core ethos of a successful trend follower, they do not allow a trend to last for too long. They take advantage of the momentum of the market when it is working in their favor and they act quickly when trends turn against them.
What are “Contrarian Indicators”?
Contrarian Indicators are a class of investment strategies specifically designed to help an investor make determinations based on an assessment of market sentiment. While many behavioral finance-based strategies attempt to predict the future movement of investments using market sentiment as a guide, contrarians rely on an analysis of the relationship between sentiment and prevailing market conditions to achieve their investment objectives.
What Are “Selling Surges”?
Anticipating selling surges by other traders can be a very powerful way to protect your portfolio from price swings in your favor and to take advantage of price swings against you; a process known as “eating your own cooking.” In trading, you are leveraged in that you hold a financial instrument for a short time frame, so it can go both up and down in price very quickly. To make matters worse, traders (particularly speculators) often lever themselves even further—what the market and speculators call “taking on risk”—so that they can get more return with leveraged investment instruments such as futures and options.
A selling surge is a situation where speculators lose their money so fast that they get sucked in deeper and deeper—generally by their own desperate selling. As they liquidate their positions to pay down their debt, they drive their prices down with them at the same time that they cause other speculators to close out of their positions to take negative marks. A selling surge is not the same as a crash, therefore; it is a situation where speculators are forced, through loss of their own resources, to sell, which causes other speculators to do likewise, etc. A selling surge is not necessarily related to fundamentals; it is a situation caused by the continual loss of real money.
What is “Trend Reversal”?
The trend reversal indicator is a technical analysis strategy involving the study of security price series momentum. Rather than evaluating a “correlation coefficient” between two or more time series of security prices, the trend reversal indicator is a practical application of momentum theory which seeks to adhere to the rules of portfolio theory by exploiting a trend reversal condition.
The trend reversal indicator is designed to operate with purchases and sales of securities based on a quantitative trading strategy involving any stock, stock index or stock option traded on any market. In fact, there is no particular benchmark security which is required in order to develop and conduct a trend reversal security trading system.
What is “High Beta Strategy”?
High beta strategy is a technique which recognizes that a trader generates larger returns when his portfolio has a higher beta, or volatility, than the overall market. A high beta strategy uses equity index futures to achieve a higher beta than the main market. Either pick stocks in a certain area or market or buy an index such as the Russell or Nasdaq dipped futures. Holding the stocks and dip futures results in a significant amount of beta being generated, and in the short run, a trader earns a higher return than buying the stock.
What is “SuperTrend GAP”?
The SuperTrend GAP is formed by identifying extremely strong and persistent directional price trend, which is characterized by its extreme duration, high volatility, high volume and strong directional-price continuation. This research confirms the existence of a huge price GAP in any flexible interval of time. In order to identify the existence of a SuperTrend GAP, two basic procedures are applied:
1- Exhaustive statistical analysis is applied to any flexible time-frame of price movements (minutes, hours, days, weeks, months, quarters, years) in order to:
Xa- Find the existence of any GAP in any time interval (duration, volume, volatility, upward/downward directional trend) and
Xb- Evaluate its statistical significance.
2- The findings in 1 are used to determine the existence of SuperTrend GAP.
What is “BullTrend Signal”?
BullTrend signal is an indicator designed to take advantage of a strong trending market by calculating the best entry of when the trend first starts to change. It removes the “human error” factor by calculating exactly when the trend starts to change. It does this by:
Calculating a confirmed uptrend for a historical period of time (for example, 10 intervals)
Watching for the first confirmed ten intervals of downward price movement resulting from the end of the uptrend
What is a “Breakout & Reversal Strategy”?
A Breakout & Reversal Strategy is a trading technique for when a large price move, beyond the normal range of a security, has taken place. It can be used to enter a trade in a security after a large price move has occurred.
The breakout & reversal strategy is based on two primary trading techniques: the first is an upside momentum-based trading strategy, the second is a price pattern analysis.
What are “Oversold/Overbought Stock/Index Indicators”?
Oversold/Overbought Stock/Index Indicators are based upon the idea that certain market conditions tend to continue longer than others and sometimes in the opposite direction. Oversold and overbought readings are important in determining when a change in trend occurs. For example, assume that a chart for a hypothetical stock or index shows a period of general price decline. During this slide, the indicator hit a maximum oversold reading leading to the belief that the stock or index was highly oversold. However, the indicator would have reached a peak oversold reading two weeks after the stock or index had already bottomed and started to rally.
What are “Volume” and “Volatility”?
Simply put, the volume is the number of shares traded over a period of time, and is one of the most important factors that analysts consider when evaluating a security or a market. The volume level is used to determine the liquidity of investors in a security.
Volume is measured over any given period of time, typically based on volume in the stock market. It is meant to help in analyzing the overall level of activity in the market.
Volume is also important for determining the price direction for securities and how they impact short-term price movements.
What are “Overbought/Oversold General Price Indicator”?
The Overbought/Oversold General Price Indicator is a non-directional indicator developed for the purpose of identifying general overbought or oversold conditions for any market or any activity that has the potential to generate a price movement.
It is a very simple concept: when a general price indicator, e.g. general price index, reaches a maximum reading it is considered to be “oversold” and when it reaches a minimum reading it is overbought.
What are “Long/Short” Indicators?
The Long/Short indicators are designed to show which is the better-performing market for a given period of time. In the first year, the measure will show if the number of long positions is greater than the number of short positions, or if the number of short positions is greater than the number of long positions. As time goes on, the measure will track the numbers of long and short positions for each month. The standard measure is the average number of outstanding long and short positions over the month. It is also useful to see the trend in long and short positions over time.
It is a simple principle which stipulates that the market is more efficient when there are more trades.
What is a “Stochastic Trading System”?
A Stochastic Trading System features stochastic oscillator, a momentum indicator which has been widely used by technical analysts of stock and commodities markets to identify overbought and oversold conditions. Its popularity arose from the fact that its signals are contrary to those generated by the Relative Strength Indicator (RSI) and the Commodity Channel Index (CCI), the two indicators commonly used by technicians to measure price momentum.
What are “Crossovers”?
A crossover is the point where two indicators move from one side of the page to the other, the upper side of the page to the lower side, or the lower side of the page to the upper side. Crossovers can be bullish, bearish or neutral depending on the type of indicator. For example, an overbought crossover in an indicator with a bullish bias is bullish. A crossover is not considered a signal, but it should serve as a warning of possible changes in a chart´s price trend.
There are three main types of crossovers available, standard, average and advanced. The standard crossover is the most popular type of crossover. It involves a single indicator and attempts to predict the future trend of a security by looking at a crossover signal formed by the particular indicator. The average crossover involves two indicator crossovers instead of one. The advanced crossover involves three or more indicators performing a crossover at the same time.
What is the “Total Predicted Probability”?
The Total Predicted Probability is the predicted probability of a signal, taking into account the percentage of the time that the signal has been accurate in past instances. The indicator compares the actual outcomes against the results generated by a random movement, or noise, on the specific chart pairs.
What is a “Magic Number”?
As the name implies, at any given time, a magic number will always be what it is for a specific market. It is very rare that the magic number changes. It is a number based on the assumption that it is normal for a security to make price moves of up to 20-25% in any given time frame. It is important to note that this is the normal, not always the case.
What is a “Mean Reversion Signal”?
Mean Reversion Signals are indications that a security has been acting abnormally for an extended period of time. Mean reversion signals are observations used by technical analysts to determine when the current trend in a security is expected to revert to a historical mean. Mean reversion signals can be contained within a single chart and are based entirely on classical technical analysis.
Mean reversion signals are used in conjunction with other indicators to obtain a more accurate prediction when a security will begin to revert or return to its long term mean.
What is a “Price Pattern”?
A price pattern is a specific type of chart pattern that most commonly forms as a result of technical analysis. Typically, price patterns are found on bar or line charts and are used by technical analysts to determine future price direction. Traditionally, technical analysts have used price patterns as a means of identifying entry and exit points for trades.
What are “Intraday Trade”?
An Intraday Trade is a short term trade that takes place in less than 1 day, such as minutes, hours or even a hundo.
Benefits of CTA Trading Strategy
CTAs trade a variety of financial instruments (currencies, commodities, equity index ETFs, futures, etc) [For example, the global macro strategy and the global macro and relative strength strategies].
CTAs do not attempt to forecast economic variables, factors that affect a country´s interest rate, the impact of a particular country on global markets, etc.
CTAs attempt to profit from price movements and carry trades in otherwise relatively anlyotrically tradiable markets or segments, and hence potentially offering a flanking strategy to a mixed portfolio of investment tools.
CTAs approach the market in a systematic way and look at the overall market, not at specific stocks. Usually they do not have a lot of guesses or risks, due to the trading styles they use. They concentrate on having a realistic probability of describing the market. Although it is hard to predict how the market will move, CTA´s are capable to predict the likelihood of a price movement, which decreases the risk or the downside of a trade.
Thanks to the statistical approach they have with the market, nowadays, the strategies are so good that they offer profitability in the short term and sustainable returns in the long run. So, in the long run, a CTA is a fixed-income product but without the risk A great part of their profitability depends on how much they are charged in order to handle their money. This is the “management fee“. In general, the higher the MAF (Management Agreements Fee Rate), the worse.
CTA´s Investment Strategy
All CTA´s are, essentially, a long only contract in which the CTA acts as a counterparty. The investor has a long position in his account and the CTA has a corresponding short position.
What is the Role of the CTA?
The CTA acts in an advisory capacity to the investor. The CTA must do the following :
Make investment recommendations to the client based on the CTA´s trading model(s).
Monitor the markets continuously and execute the trades established by the investment model.
Handle all trading decisions (i.e. open and close positions) and confirm all orders via voice, e-mail or CCQ’s.
Management and settlement of client´s account in the trading platforms.
What is « Positive Carry »?
Positive Carry is the favorable rate of return given to the Swap Provider.
What is « Negative Carry »?
Negative Carry is the unfavorable rate of return given to the Swap Provider.
What is « Swatch »? – « Swaption »?
Swatch is a mechanism enabling a CTA to generate revenue from an underlying investment. It is similar to options.
Why are Swatches Called Swatches?
“Swatch” is a reference to the wristwatch with a built-in LED display. Swatches are sometimes referred to as Swaptions, because they are a derivative of the option.
What is the “Spread”?
A Spread is the difference between the Bid (buy) and the Ask (sell) price.
What is “Premium” and what is “Discount”?
A Premium is the amount you pay for a security. Conversely, a Discount is the amount you receive for a security.
What is “Premium or Discount Payoffs”?
Define the time that you want to execute the trade. The difference between the Premium and the Discount is the profit from the Premium Payoffs and the Discount Payoffs. If you have bought Premium, you sell Discount. It is true in reverse. If you have bought Discount, you sell Premium.
What is the “Turnover”?
The Turnover is the number income obtained from trading. The Turnover is expressed as the annual percentage of the assets under management (AUM).


