Do you want to create beautiful data visualizations, but don’t know where to start? Well, look no further! In this blog post, we will discuss the best place to buy data studio templates. Data Studio is a powerful data visualization tool that allows you to create stunning visuals with ease. However, it can be difficult to get started if you don’t have any templates to work with. That’s why we recommend buying data studio templates from a reputable source. In this blog post, we will discuss the best place to buy them and provide a few tips on how to choose the right template for your needs.
What are data studio templates and what are they used for?
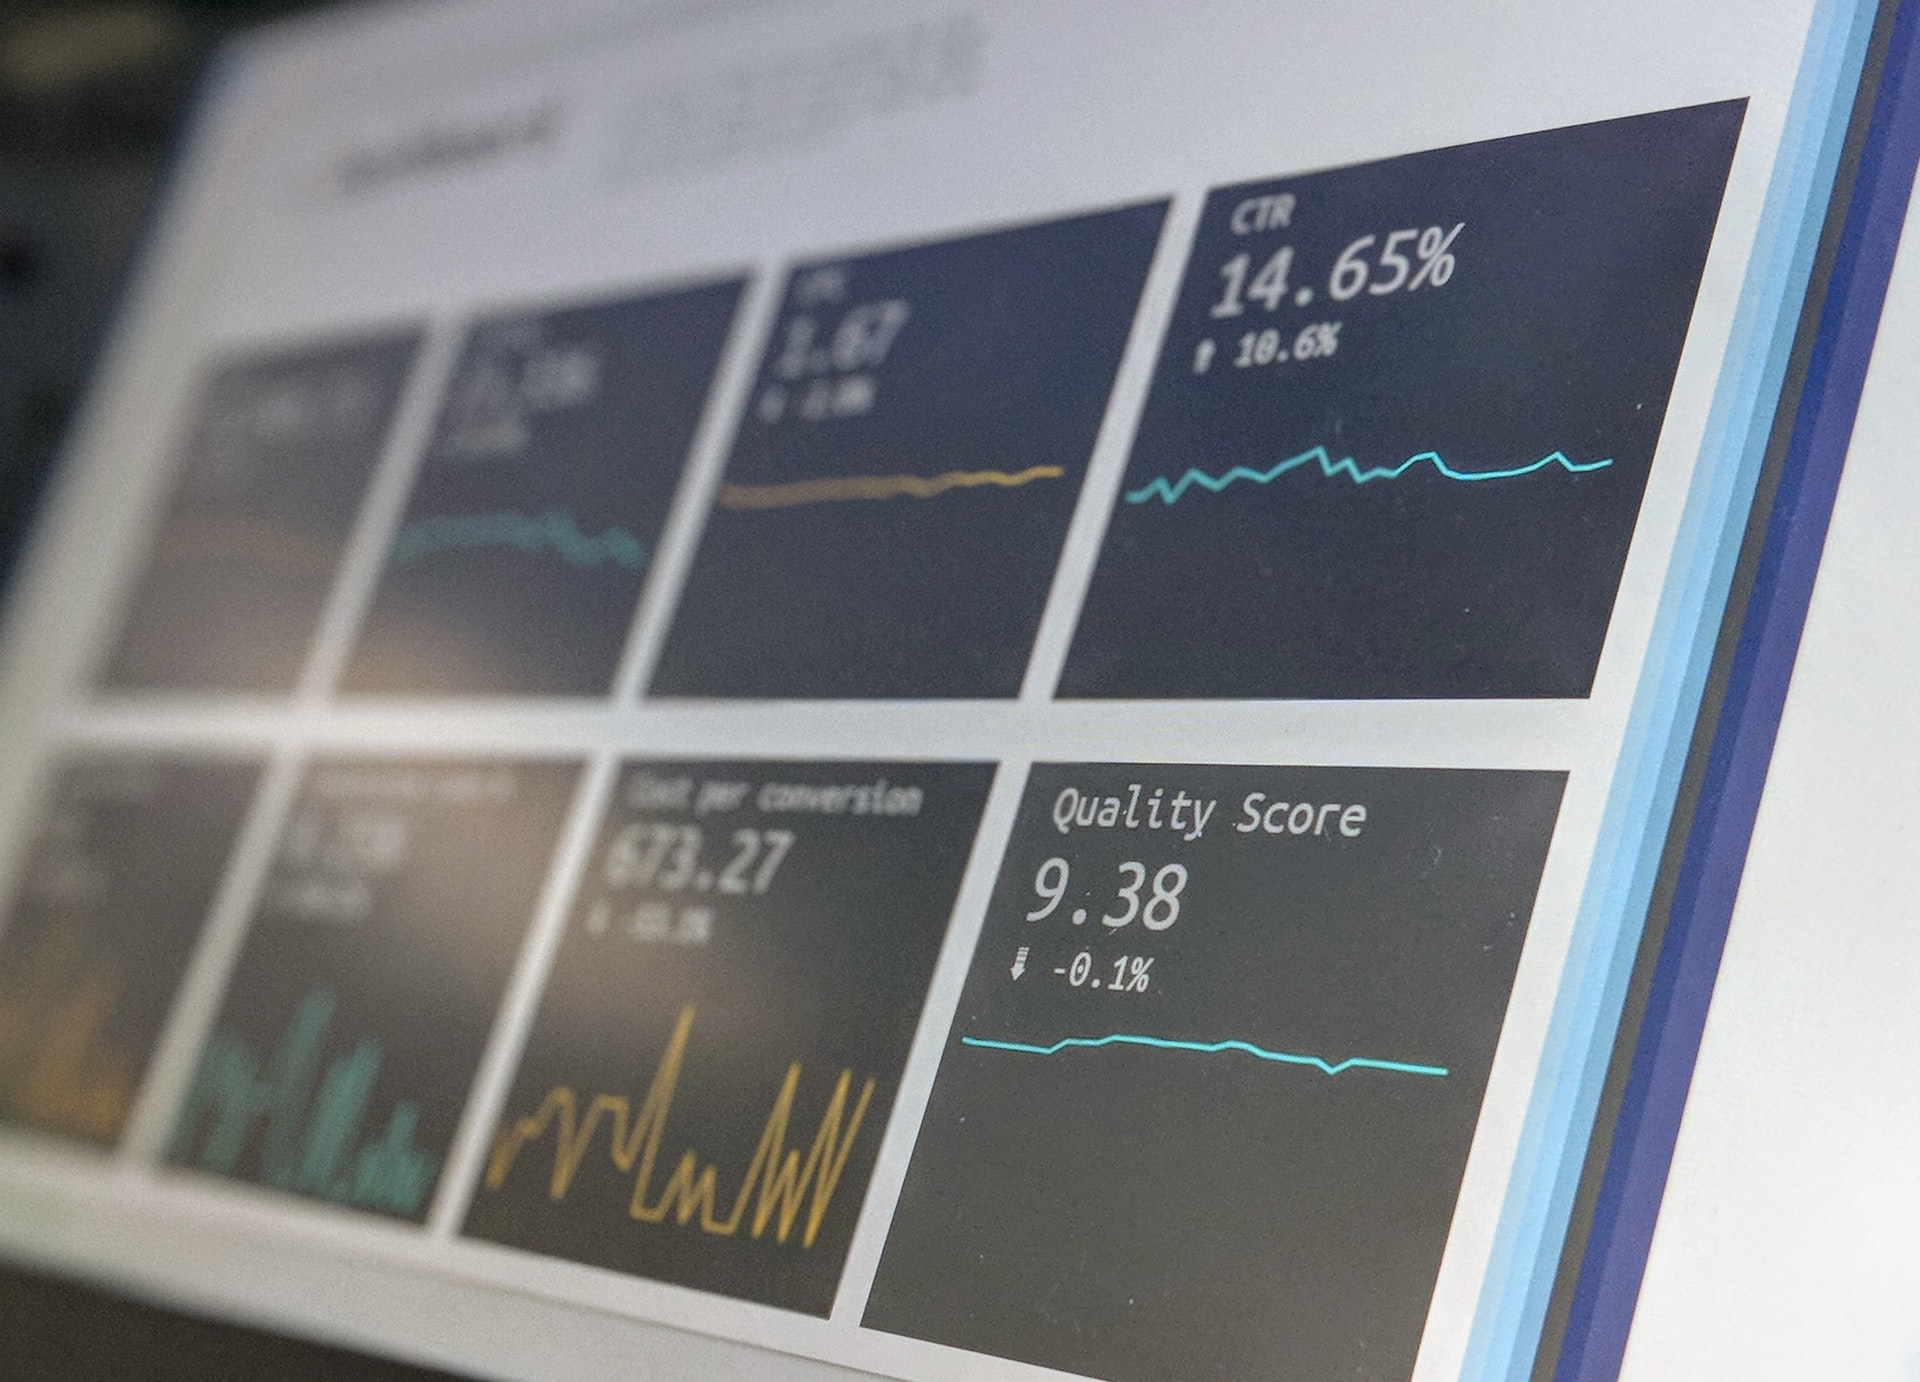
Data studio templates are pre-defined, reusable reports that you can use to quickly create data visualizations. They can be used for a variety of purposes, such as benchmarking your business against industry rivals, tracking website traffic over time, or measuring the success of a marketing campaign. Most data studio templates include pre-populated charts and graphs, which make it easy to get started with data visualization. You can also customize the template to fit your specific needs or create your own from scratch.
Why would you want to use data studio templates instead of creating your own reports from scratch?
There are a few reasons why you might want to use data studio templates instead of building your own reports from scratch. First, templates can save you a lot of time by providing a pre-built framework for your report. Second, templates can be easier to use than building your own reports, since they often come with built-in instructions and support. Third, templates can help ensure that your reports are consistent and professional-looking. Finally, using data studio templates can help you take advantage of the best practices established by other users, which can save you time and effort in the long run.
Are there different types of data studio templates available?
There are different types of data studio templates available. There are templates for different purposes, such as marketing, sales, and accounting. Each template is designed to help users visualize their data in a specific way. For example, the marketing template includes visualizations for metrics such as website traffic and conversion rate. The sales template includes visualizations for metrics such as sales volume and pipeline status. The accounting template includes visualizations for metrics such as profitability and cash flow.
How to choose the right data studio templates for your business needs?
There is no one-size-fits-all answer to this question, as the right data studio templates for your business needs will vary depending on the specific industry and type of business you are in. However, there are a few general tips that can help you choose the right template for your needs:
1. Start with a template that closely matches your industry/type of business. This will make it easier to customize the template to your specific requirements.
2. Make sure the template includes all the fields and metrics you need to track. Otherwise, you’ll have to add these later, which can be time-consuming and complicate things unnecessarily.
3. Consider how complex your data is and whether you need a more sophisticated template to accommodate it. If you’re not sure, err on the side of simplicity – you can always add complexity later if needed.
Where can you find high-quality data studio templates that are affordable and easy to use?
There are a number of places to find high-quality data studio templates. One great resource is Google’s own Data Studio gallery, which offers a wide range of premade templates that are easy to use and customize.
Another great option is Template Gallery, which offers a wide range of data studio templates for free or for purchase. The templates are easy to use and can be customized to fit your needs.
Finally, you can also create your own data studio template from scratch. This can be a bit more challenging but it allows you complete control over the design and layout of your report.
Tips for creating effective data visualizations with data studio templates?
There are a few key tips to keep in mind when creating effective data visualizations with data studio templates:
1. Make sure your data is well-organized and clean before beginning. This will make it much easier to work with in the data studio and produce more accurate results.
2. Utilize as many different visualization types as possible to best understand and communicate your data. Data Studio offers a wide variety of charts, graphs, and other visuals to choose from – use them all!
3. Pay attention to the details. Small changes can often make a big difference in how effective your data visualization is. Things like color choice, labels, and axis formatting can all impact the final product.


